When I analyze data, many times, I need to group different data source one with another. In such a situation, there is a need for playing with large datasets. One of the functions that I use in many cases to make my data clean when combining different data sources is the UNIQUE function in Google Sheets. This is one of the simplest functions.
For example, I can have several thousands of rows of data that will contain the unique number of customer. From this data, I can not see how much unique customers I have in the data. Or sometimes I want to create another table that will contain my unique customer ID, gender, marital status, city and region from my initial table. Here is my initial table with the data related to transactions for a company.

As you can see from the data, in this table, we have the following:
- ID – this is transaction ID that is given automatically by the system.
- Transaction Date – Date when the transaction is made.
- Revenue – How much revenue we collect with the specific transaction?
- Region – From which region is the customer for the specific transaction?
- Sales team – Which sales team made the specific transaction?
- Customer ID – Unique ID of each customer
- Gender – What is the gender of the customer?
- Marital status – What is the marital status of the customer?
- City – From which city come the customer for the specific transaction?
- Product family – What is the product family for the products that the specific customer by with the specific transaction?
How Much Unique Customers I Have in this Dataset?
I want to make a column with all customers IDs from the column “F” in my initial table. As you can see in column “F,” we have different customers IDs for different transactions on different days. For example, on the January 2nd customer with the ID F0005 have a transaction with revenue of $6.461,00 (row 3). But, the same customer, the next day also make a revenue of $9.720,00 (row 6). So, specifically, I want to have a column that will contain all customers that have transactions in the analyzed period.
The simplest way, to do this is to use the UNIQUE function in Google Sheets.
I want this column to be in column L in Google Sheets. So, I will select the L1 cell and write the following formula:
=UNIQUE(F:F)
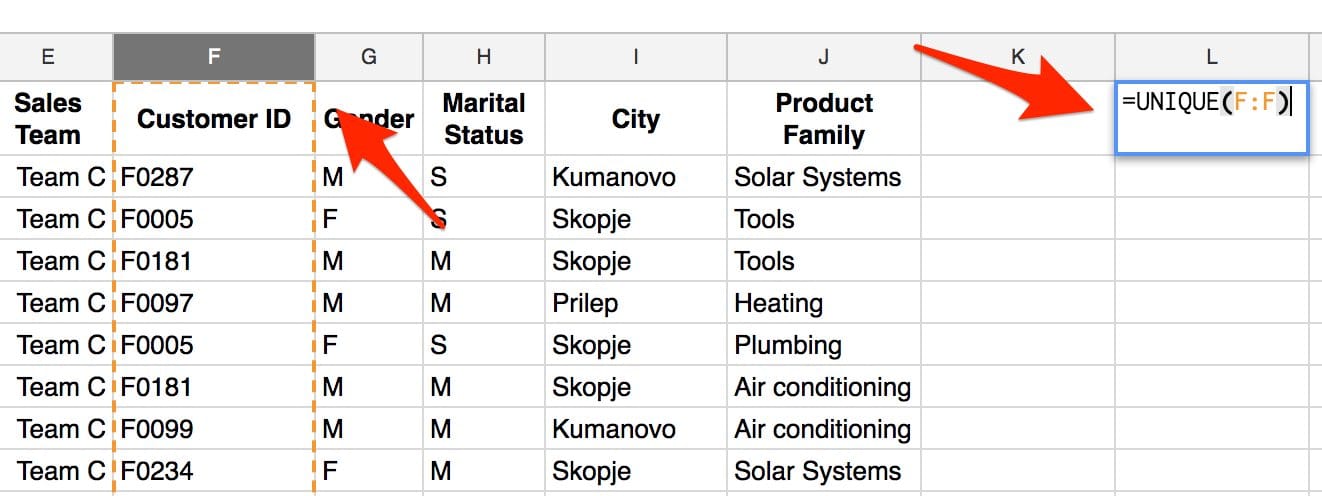
When I hit the return button, we will get the following results.
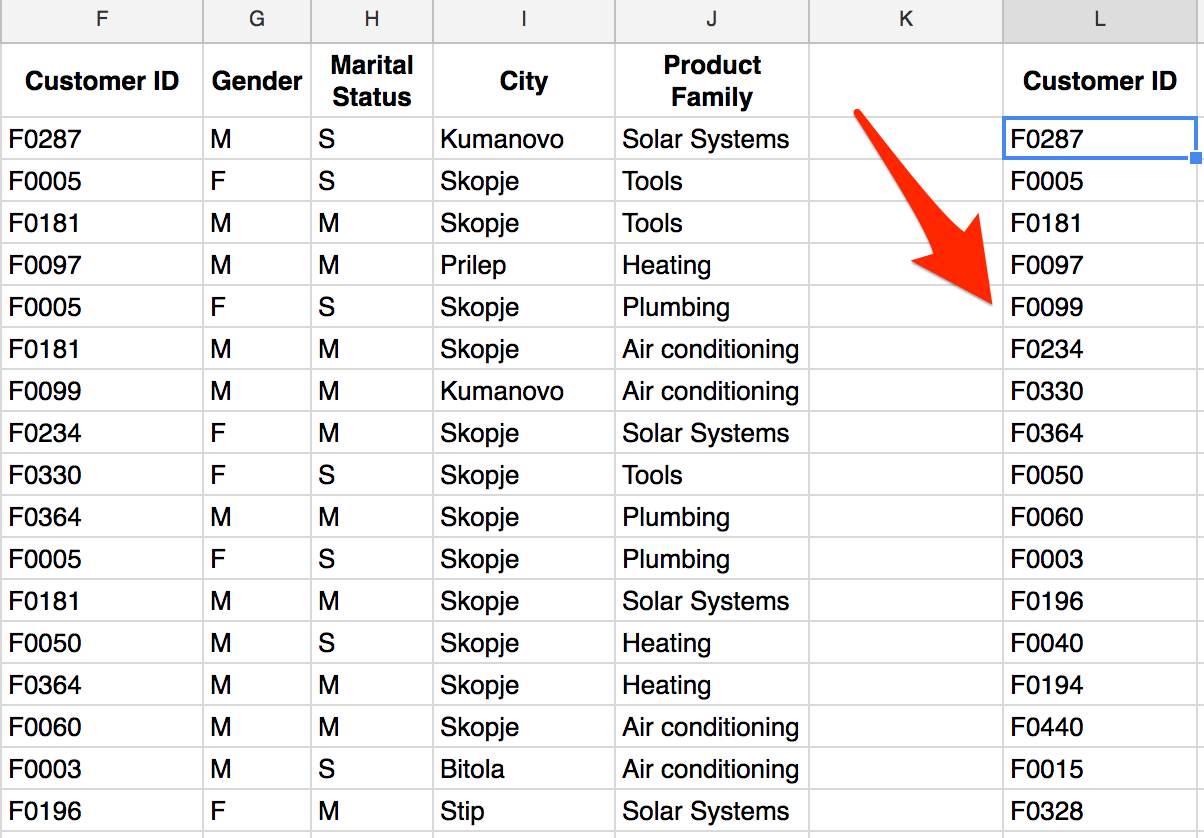
Google Sheets returns in column L unique rows from column F, discarding all duplicate values. Rows are returned in the order in which they first appear in the source range.
Now, you can see that the F0005 in the cell F6 is not presented in the new column L.
Creating Other Columns Using UNIQUE Function in Google Sheets
As I describe previously, here, I want to have unique grouped data for customer ID, gender, marital status, city and region from my initial table. This task can be easily done by using the UNIQUE function in Google Sheets.
The first thing that we need to do here is to create “Named range” for the data we want to include in our new table. I have already explained how you can create in using VLOOKUP function in Google Sheets. You can check this article.
Here I will select the columns for Customer ID, gender, marital status, city and region and with the right click will choose “Define named range…” In the Named range dialog box, I will name this range as “Customers.” Now, I can use the UNIQUE function in Google Sheets, and with the magic, Google Sheets will do the job automatically.
But let’s do this. First I will open a new sheet in Google Sheets, and in the A1 cell will start typing the function:
=UNIQUE(Customers)

After hitting return, I will get what I want to get.
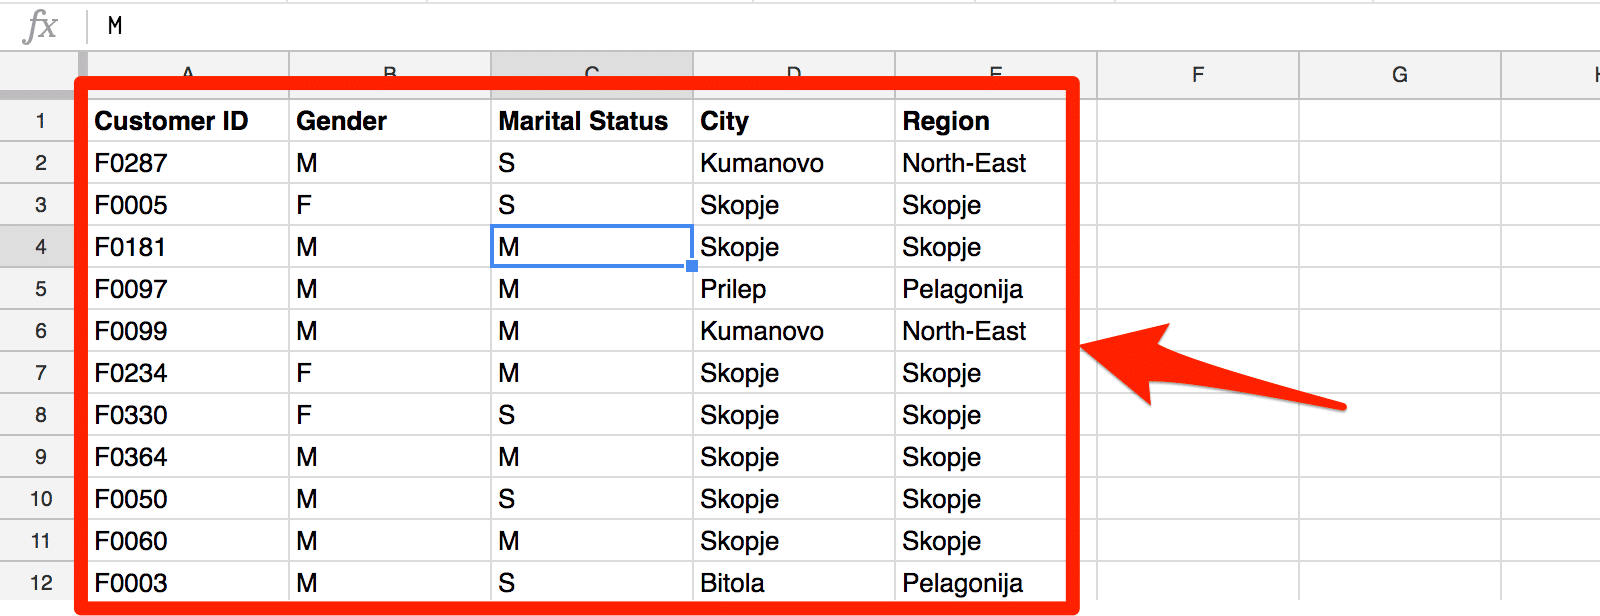
Now, I can use this table as a reference data for my customers, or to closely look into all my customers in a given period, or to use as the relation table for another analysis of data where I have the record for the customer’s ID. For example, I can relate this table with the data from customer relationship management software where I have the same Customer IDs, but additional data that aren’t present in the table we get here like, number of contacts, offers and so on. In such a way I will get the new table with additional descriptions of each customer. So, it will be easier to make correlations between different variables related to customers.


